Expected moves
Each week, the market prices in the expected move (+/-) for the given underlying asset.
Considering a 1σ (1 standard deviation) range, there is a 68% probability that the price will close within this range over the specified duration (e.g., a week).
This does not mean the price cannot move beyond these levels, especially during periods of high volatility.
However, prices often react to these levels by bouncing or facing resistance ( see examples below ) .
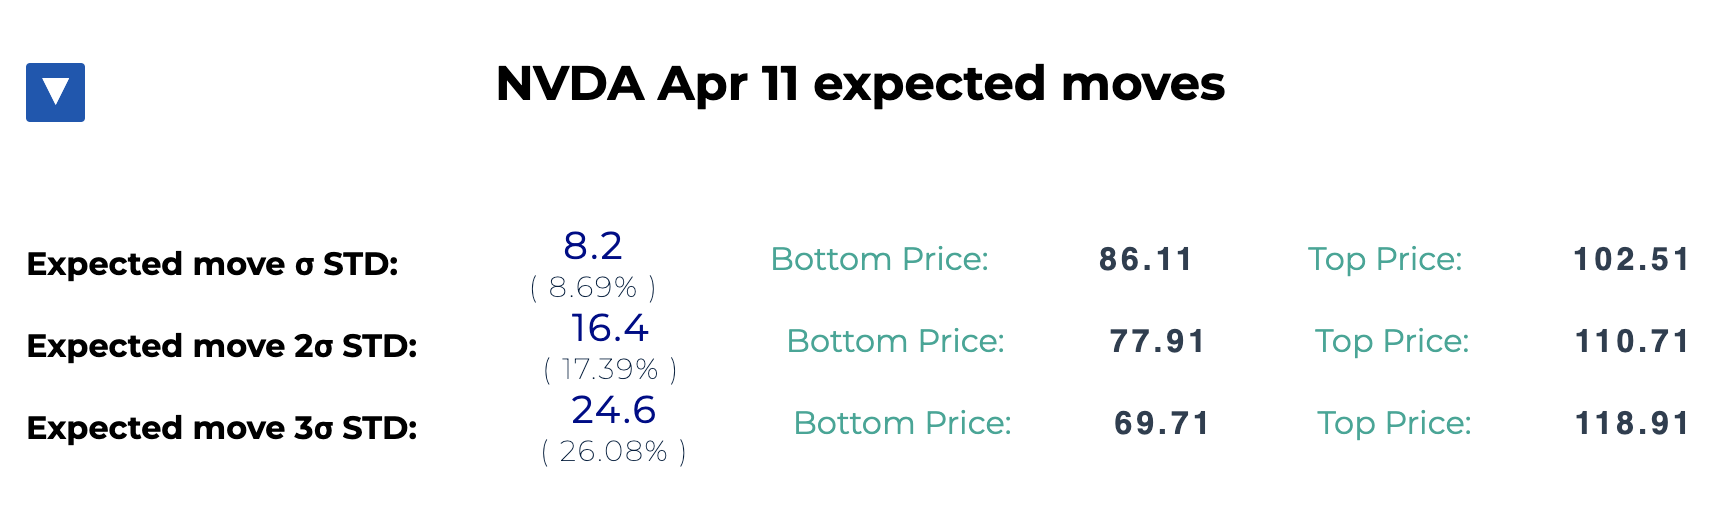
3 Standard Deviation
In periods of higher volatility, the expected move can exceed a 1σ (sigma) range.
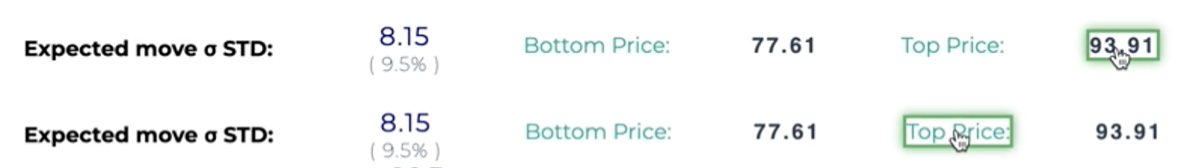
Click and Copy
Set your weekly levels on the charting platform of your choice (e.g., TradingView ). Just click on price or label and value will be copied for you
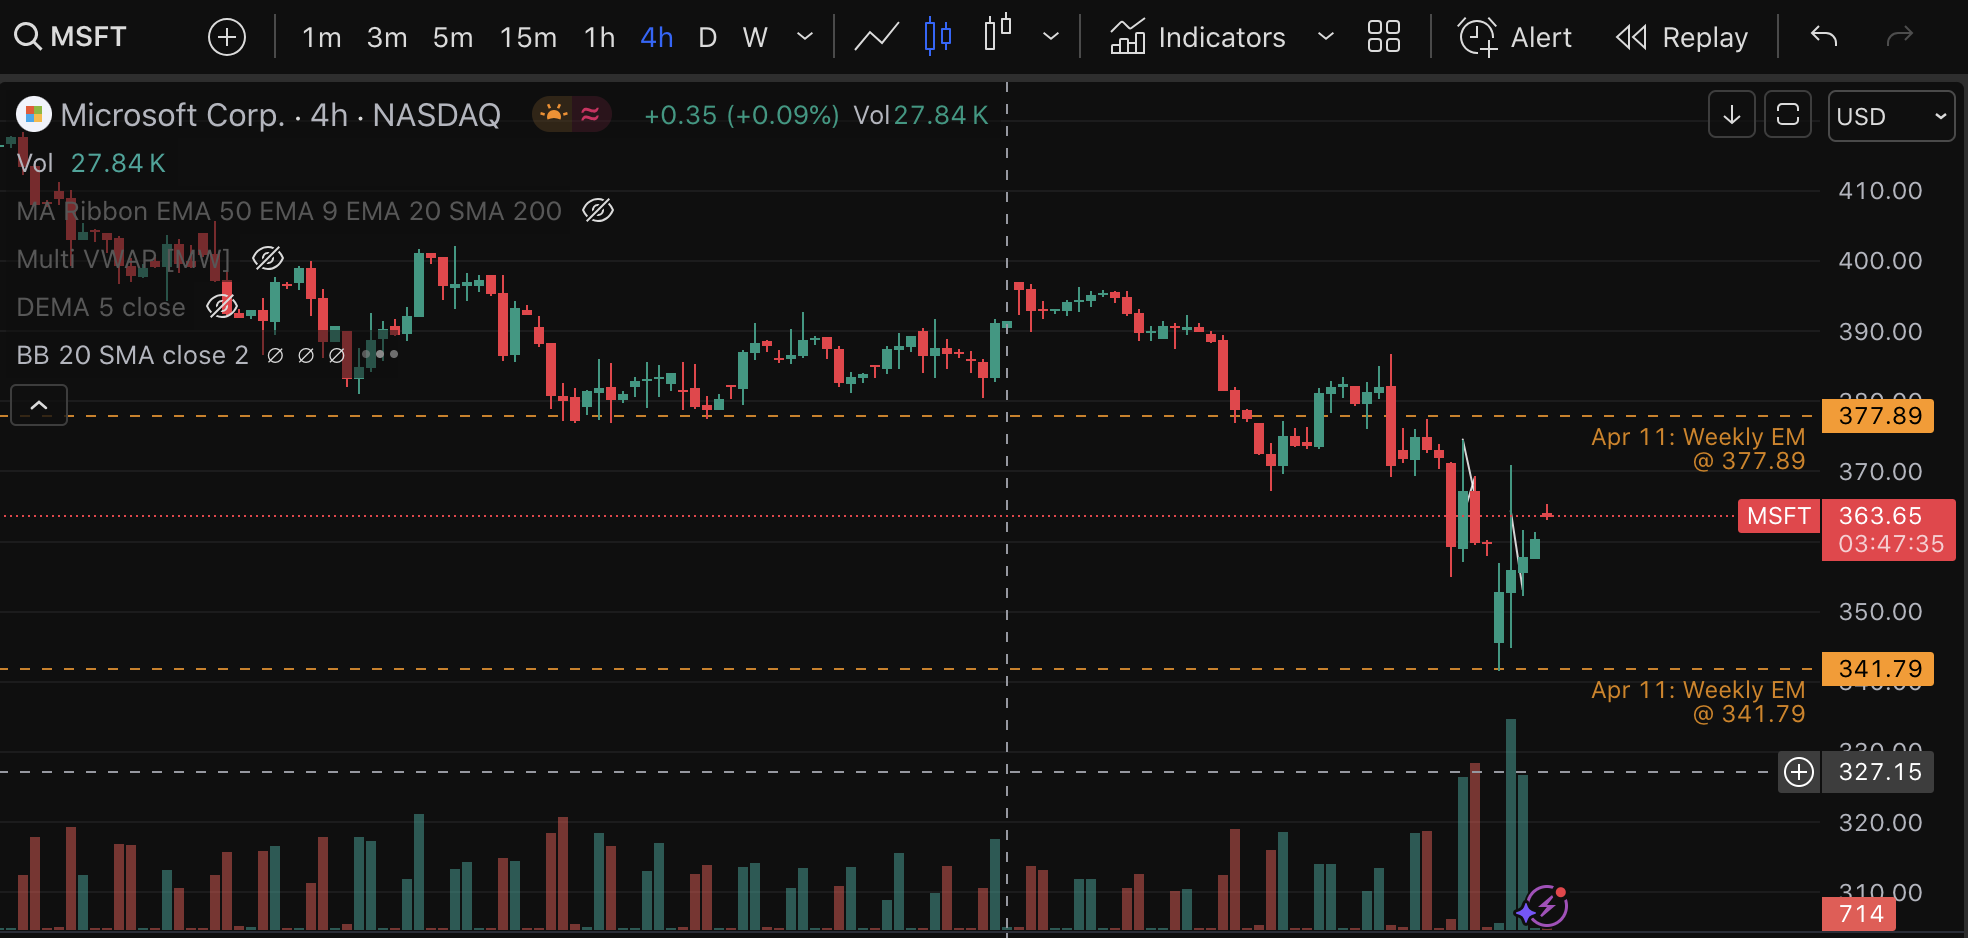
Price reaction to Expected move level
MSFT pre-market price opens at the expected level, with a 68% chance of staying above it. Hence, there’s a good chance it will bounce from it.
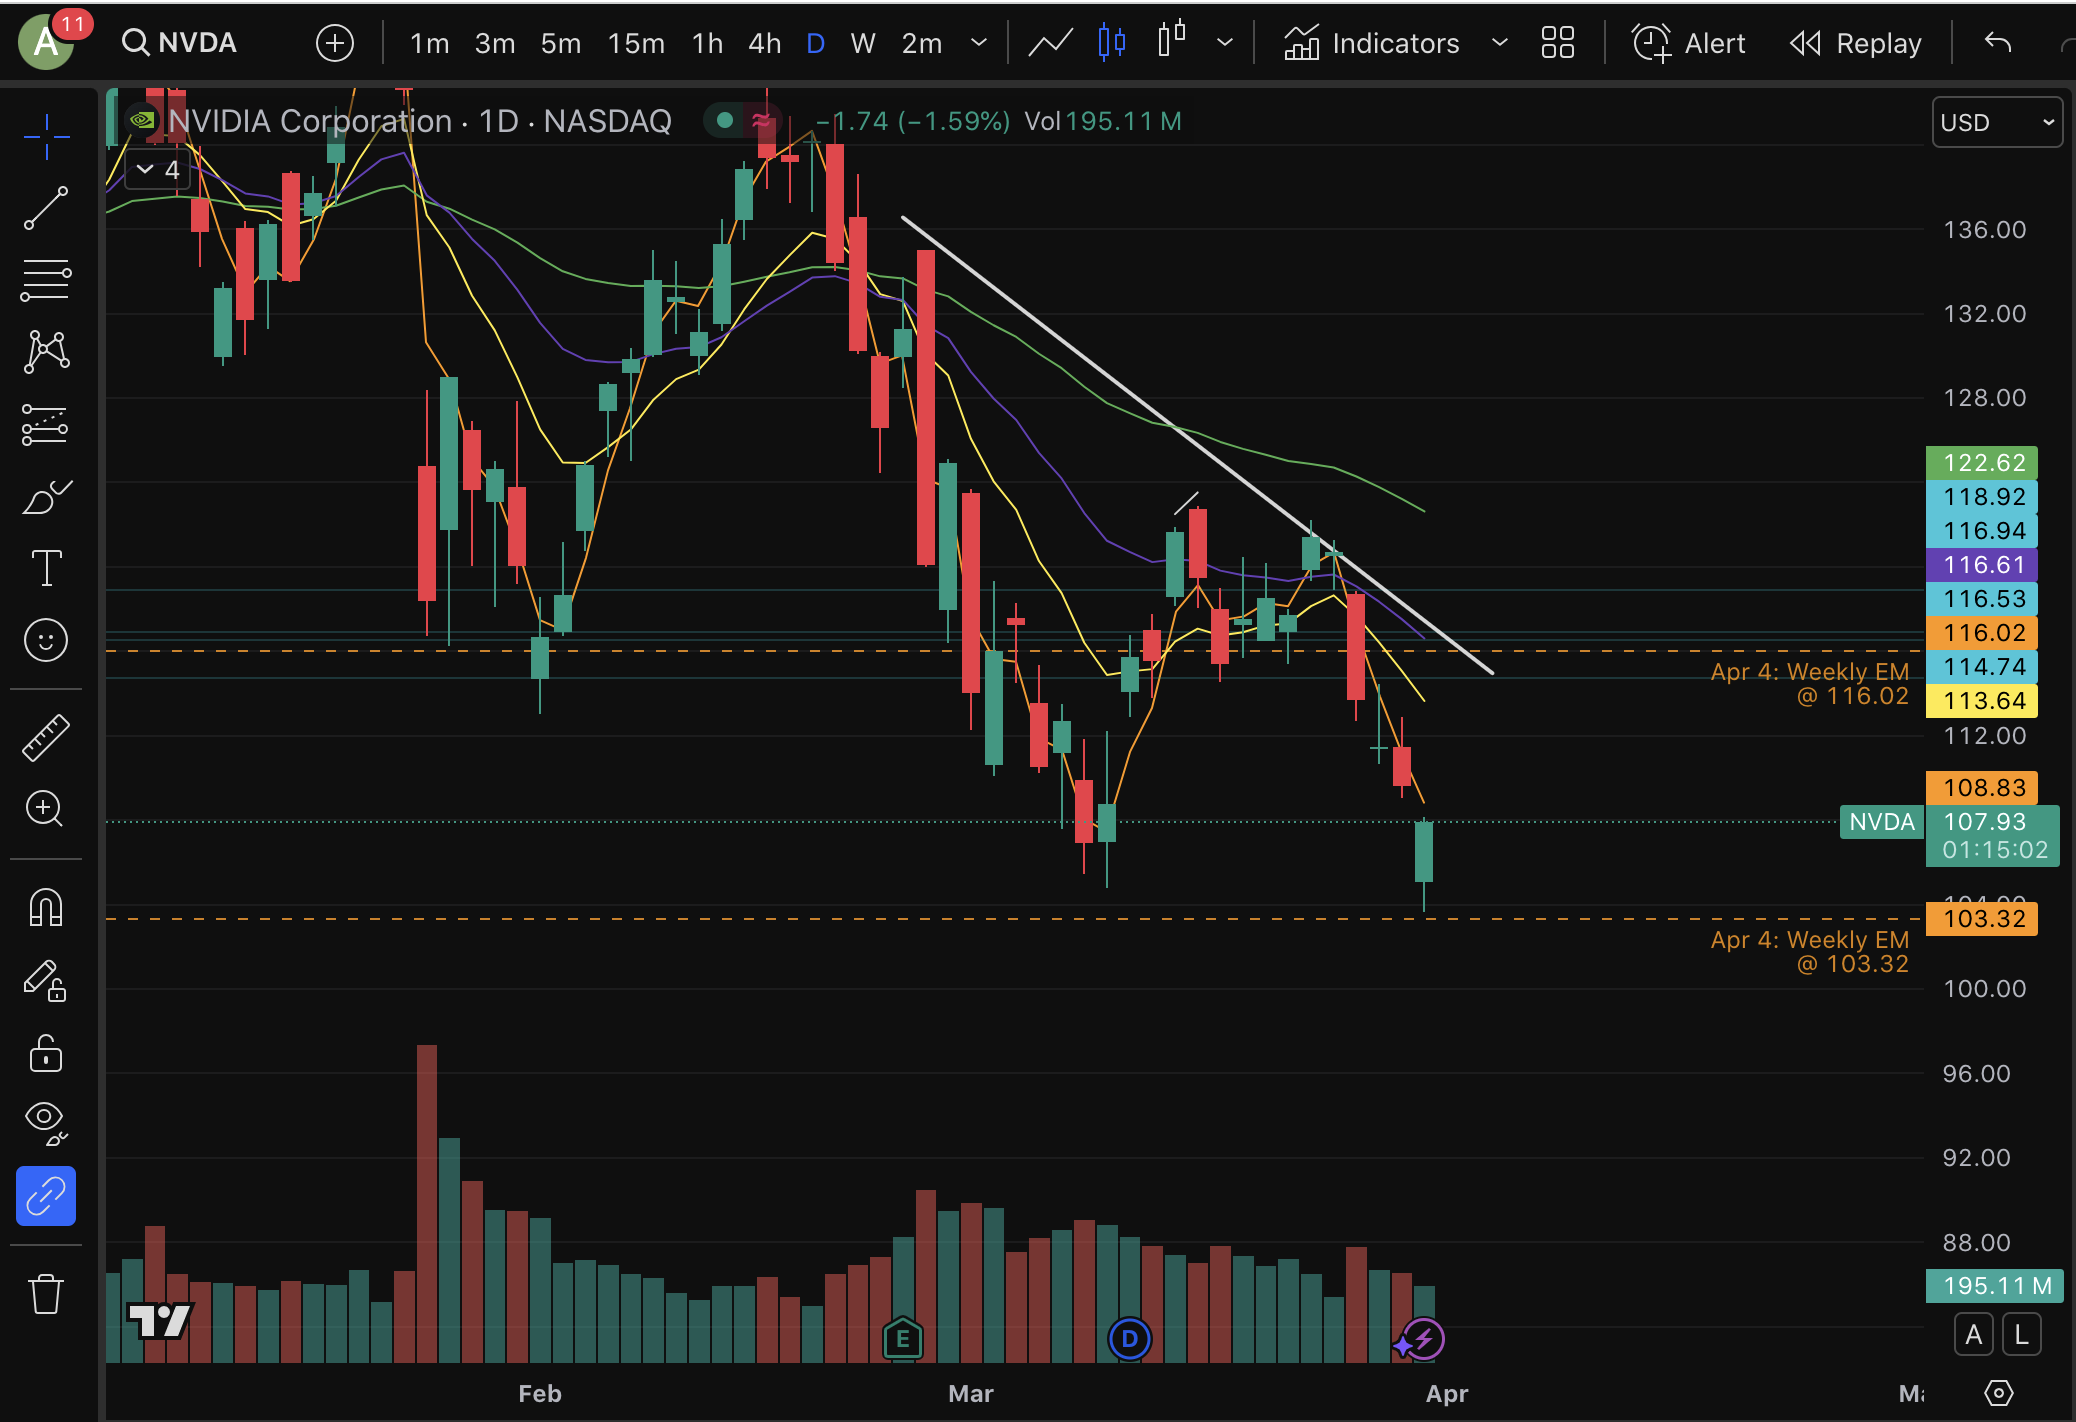
NVDA reaction to bottom expected for 4th April
We are not licensed or regulated by the Monetary Authority of Singapore (MAS) to carry out financial advisory services under the Financial Advisers Act or capital markets services under the Securities and Futures Act.
2024 - 2025 Options Jade | Terms of Use | Privacy Policy | Security